The visibility you need to make impactful real-time decisions
With ability6® you gain valuable insights into your team or organisation as a whole. On this page, we go through the various reports that are automatically produced as you use the ability6® application.
Each chart contains ‘hover over’ information – so where you see the + signal you can understand more about each report.
All reports in ability6® can be exported to PDF, Excel, or Email (at an individual or predefined distribution group level).
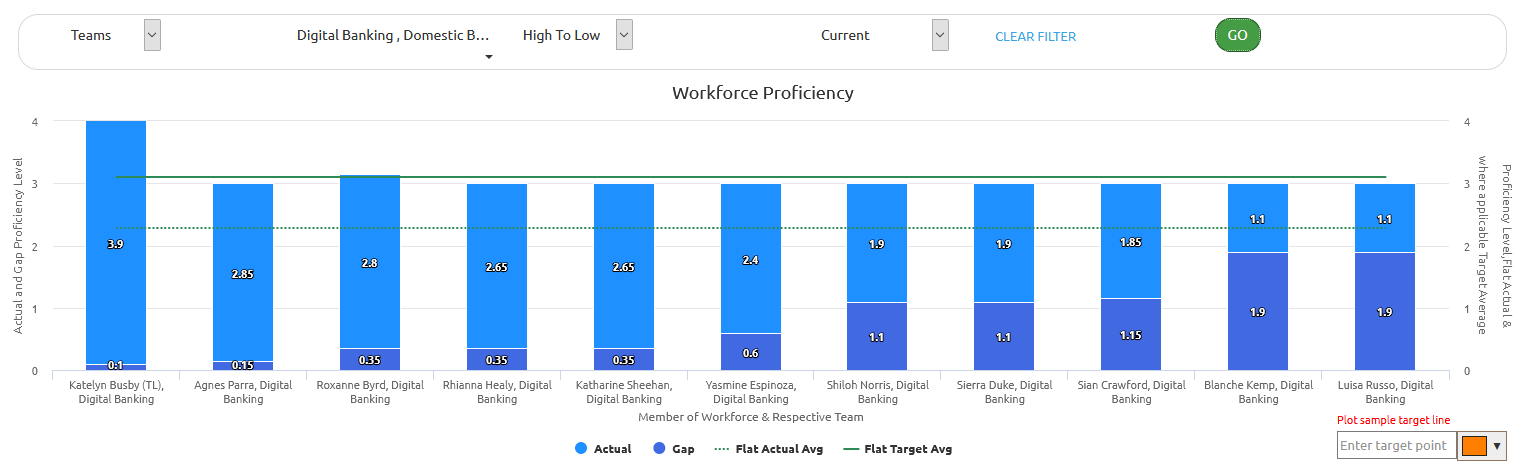
Workforce Capability Score Summary
This interactive bar and line graph illustrate the current proficiency of your Workforce. When the ‘advanced proficiency targeting’ option is enabled the bar chart stacks, showing any proficiency gaps. You can produce this report in ‘real-time’ and ‘historic’ mode.
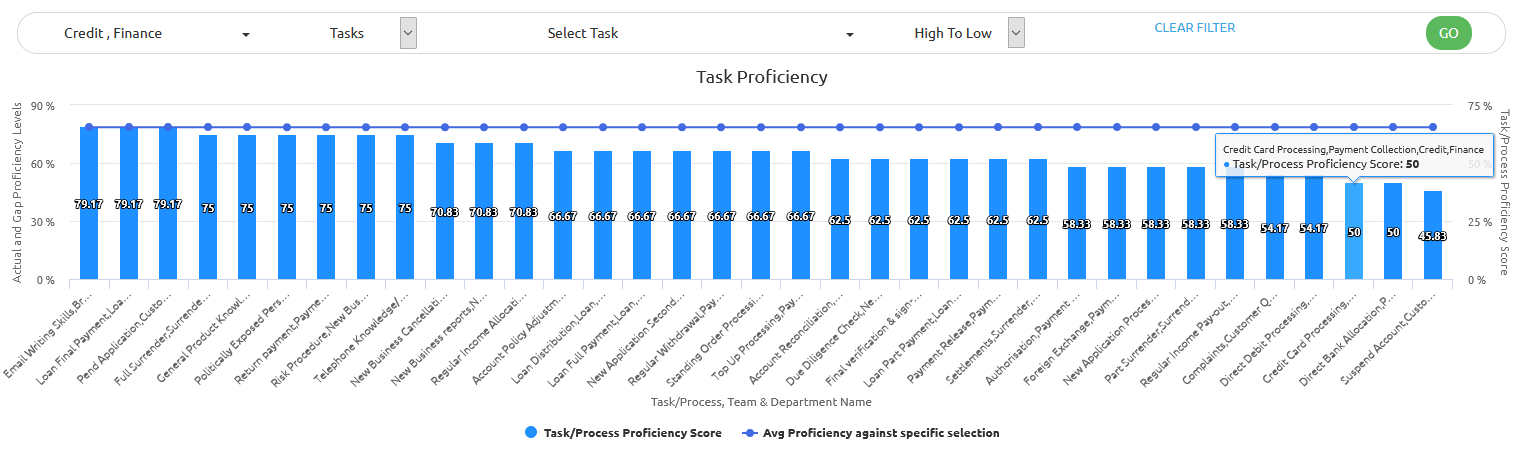
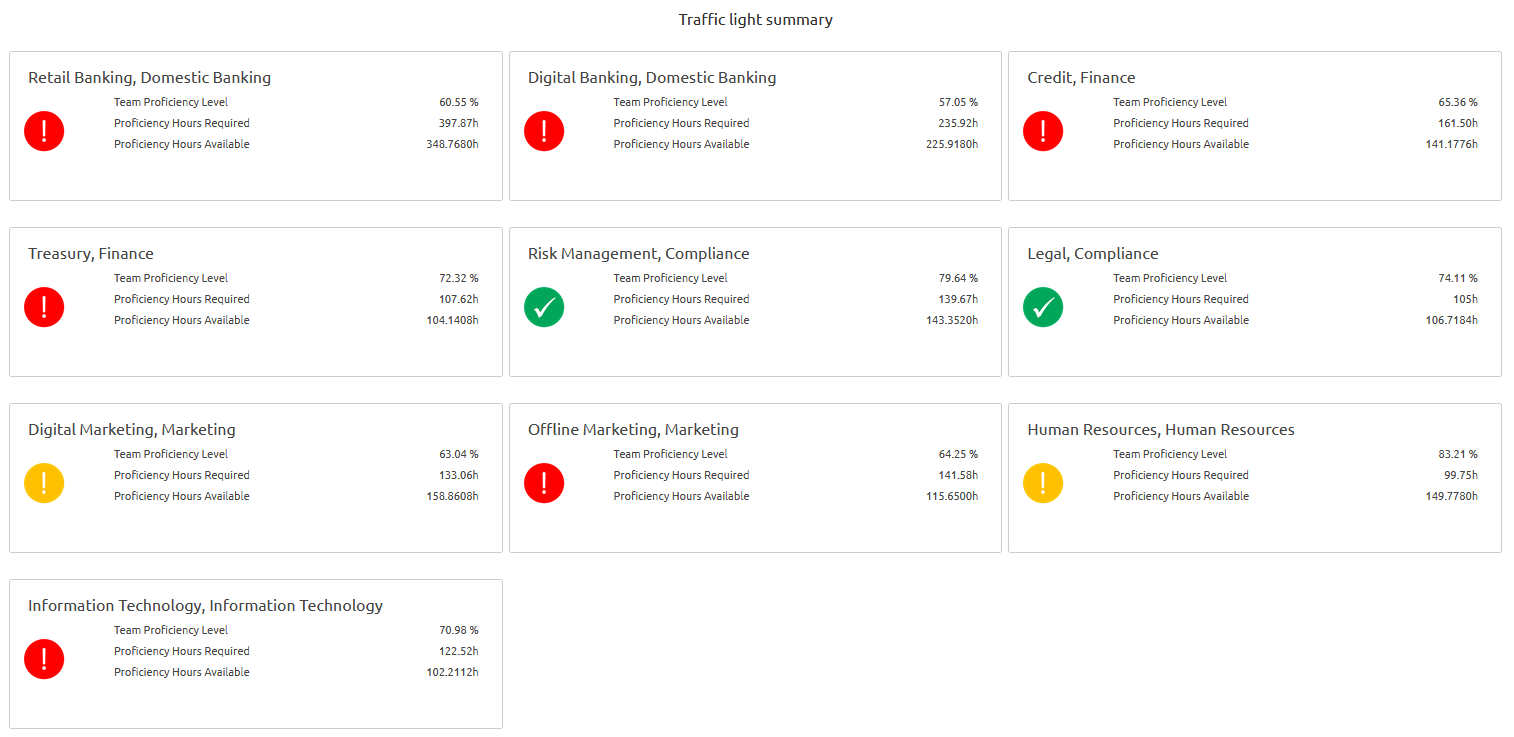
Process / Task Capability Score Summary
This section highlights the amalgamated proficiency of each of your Processes and Tasks. The report also outlines the average proficiency of the Teams, or Departments which you have selected.
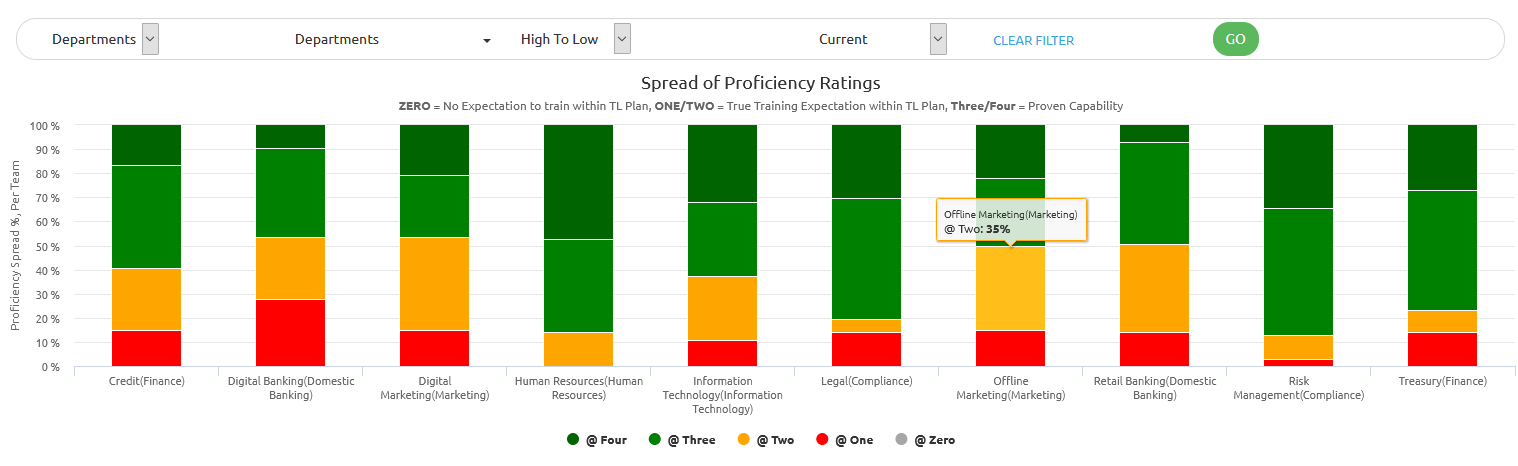
Capability / Proficiency Spread, Per Department / Team
This chart illustrates the proficiency spread of your Teams and Departments. It is colour coded to be consistent with the proficiency colours used on the skills matrix.
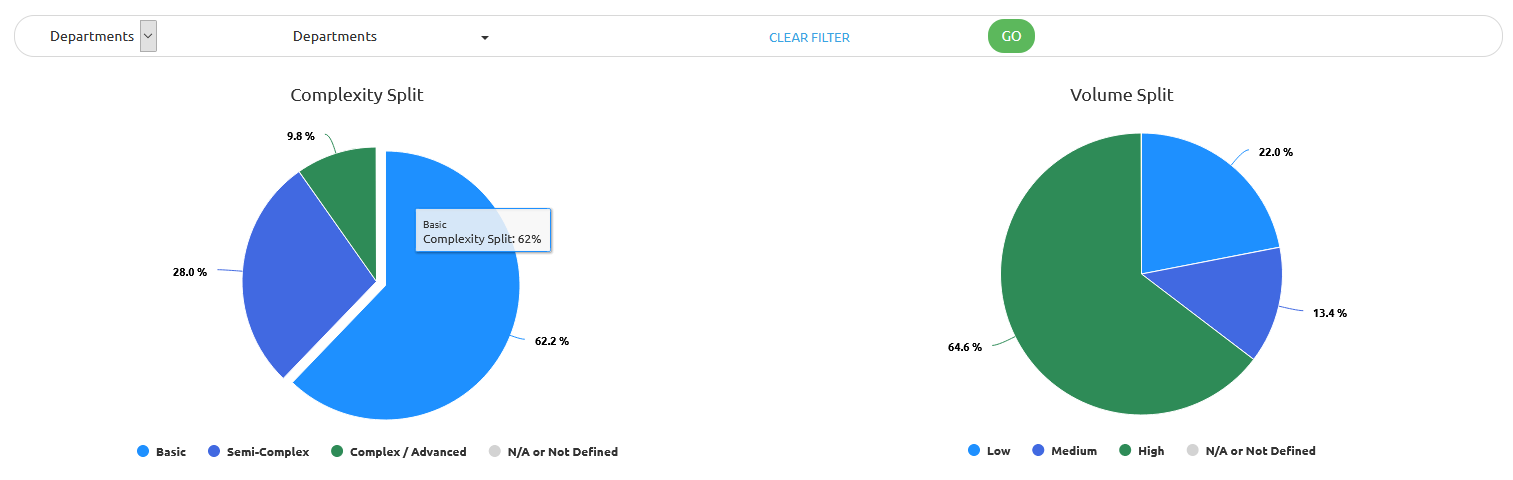
Process volume and complexity insights
Quickly generate reports at team/department level that show the split of process volume and complexity.
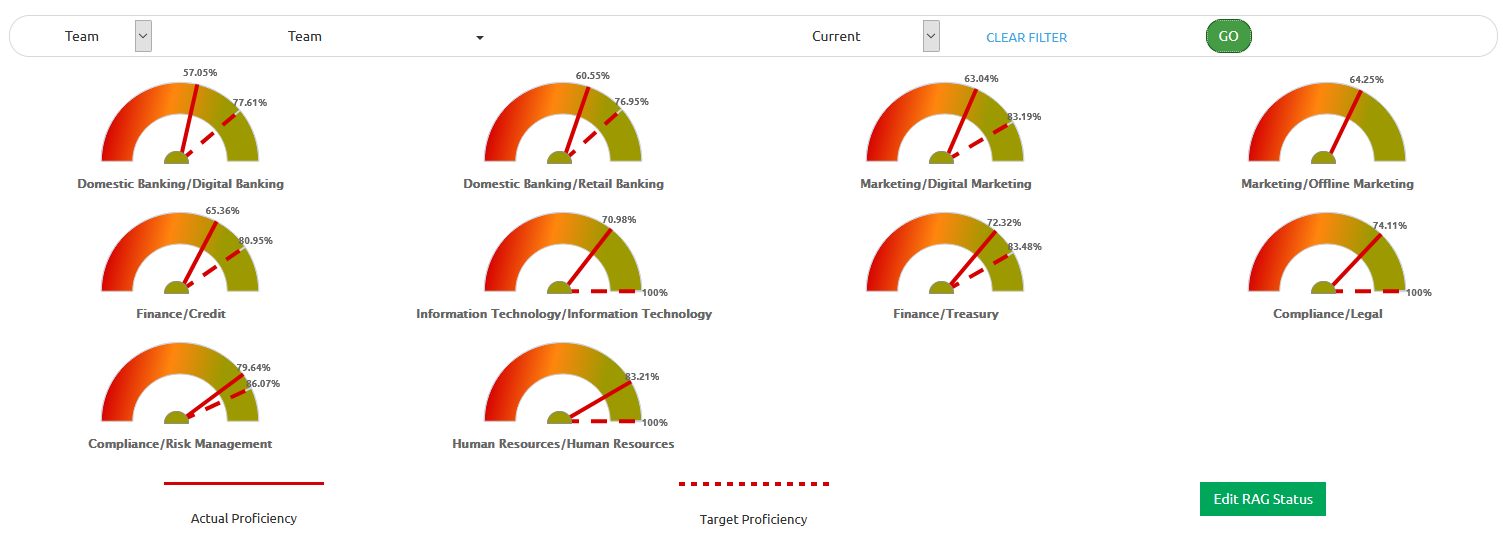
Team / Department Capability vs. Target
This interactive bar and line graph illustrates the current proficiency of your Workforce. When the ‘advanced proficiency targeting’ option is enabled the bar chart stacks, showing any proficiency gaps. You can produce this report in ‘real-time’ and ‘historic’ mode.
Weekly Capacity Planners
Visually identify the areas of your business that have insufficient, or excessive resource levels. Utilise the capacity planners to unlock resource through effective training and to utilise resource holistically for the benefit of the organisation.
View more information on Capacity Planners here.
Additional Insights
Training Insights
This report outlines the training efforts underway or completed within your organisation. It shows the split of internal/external training initiatives and courses, along with the monetary and resource costs to implement. Additionally, you are able to identify success and failure rates.
Skills Audit Insights
This report outlines the skills audits completed, pending, overdue or not set, by Team or Department.
Quality Control Insights
Identify the impact that quality has on your organisation. This report demonstrates the operational and resource costs, the number of defects and illustrates the areas that have the greatest quality control improvement opportunities.
Workforce Insights
Additional insights into your Workforce, such as above/below proficiency averages, attrition rates, Workforce demographics and more.
Executive Summary Notifications
The section intuitively analyses the data within your ability6® account and makes recommendations based on ‘presumed severity’. This feature is experimental and should not be wholly relied upon in terms of its accuracy to list improvement recommendations by priority.